KI-Beratung Beta

  • Produktbild: Introduction to Statistical Process Control
  • Produktbild: Introduction to Statistical Process Control

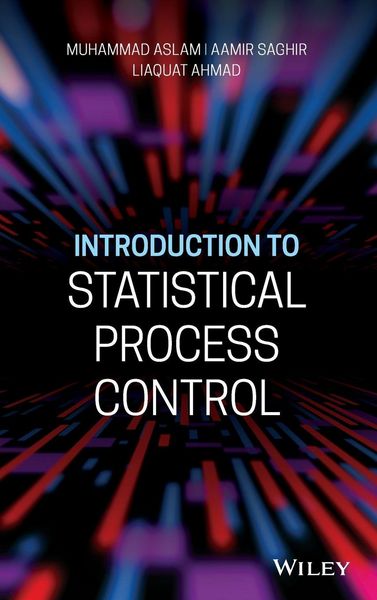
Introduction to Statistical Process Control

133,99 €

inkl. gesetzl. MwSt., Versandkostenfrei


Beschreibung

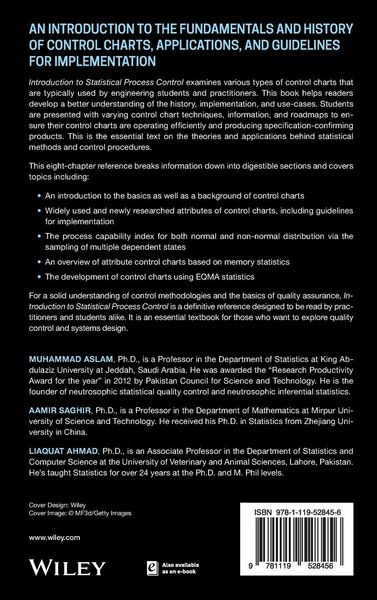
An Introduction to the Fundamentals and History of Control Charts, Applications, and Guidelines for Implementation

Introduction to Statistical Process Control examines various types of control charts that are typically used by engineering students and practitioners. This book helps readers develop a...

Beschreibung

An Introduction to the Fundamentals and History of Control Charts, Applications, and Guidelines for Implementation

Introduction to Statistical Process Control examines various types of control charts that are typically used by engineering students and practitioners. This book helps readers develop a better understanding of the history, implementation, and use-cases. Students are presented with varying control chart techniques, information, and roadmaps to ensure their control charts are operating efficiently and producing specification-confirming products. This is the essential text on the theories and applications behind statistical methods and control procedures.

This eight-chapter reference breaks information down into digestible sections and covers topics including:

An introduction to the basics as well as a background of control charts

Widely used and newly researched attributes of control charts, including guidelines for implementation

The process capability index for both normal and non-normal distribution via the sampling of multiple dependent states

An overview of attribute control charts based on memory statistics

The development of control charts using EQMA statistics

For a solid understanding of control methodologies and the basics of quality assurance, Introduction to Statistical Process Control is a definitive reference designed to be read by practitioners and students alike. It is an essential textbook for those who want to explore quality control and systems design.

Produktdetails

Einband

Gebundene Ausgabe

Erscheinungsdatum

16.09.2020

Verlag John Wiley & Sons
Seitenzahl

304

Produktdetails

Einband

Gebundene Ausgabe

Erscheinungsdatum

16.09.2020

Verlag John Wiley & Sons
Seitenzahl

304

Maße (L/B/H)

23,6/16,1/2,1 cm

Gewicht

531 g

Auflage

1. Auflage

Sprache

Englisch

ISBN

978-1-119-52845-6

Herstelleradresse

Libri GmbH
Europaallee 1
36244 Bad Hersfeld
DE

Email: gpsr@libri.de

Noch keine Bewertungen vorhanden

Verfassen Sie die erste Bewertung zu diesem Artikel

Helfen Sie anderen Kundinnen und Kunden durch Ihre Meinung.

Kundinnen und Kunden meinen

Bewertungen (0)

Die Leseprobe wird geladen.
  • Produktbild: Introduction to Statistical Process Control
  • Produktbild: Introduction to Statistical Process Control
  • About the Authors xi

    Preface xiii

    Acknowledgments xvii

    1 Introduction and Genesis 1

    1.1 Introduction 1

    1.2 History and Background of Control Charts 3

    1.3 What is Quality and Quality Improvement? 5

    Types of Quality-Related Costs 7

    1.4 Basic Concepts 9

    Continuous Probability Distributions 14

    Discrete Probability Distributions 18

    1.5 Types of Control Charts 19

    1.6 Meaning of Process Control 21

    References 22

    2 Shewhart Type Control Charts for Attributes 23

    2.1 Proportion and Number of Nonconforming Charts 24

    Variable Sample Size 28

    Improved p-Chart 29

    2.2 Number of Nonconformities and Average Nonconformity Charts 32

    Dealing with Low Defect Levels 39

    2.3 Control Charts for Over-Dispersed Data 40

    2.4 Generalized and Flexible Control Charts for Dispersed Data 44

    Process Monitoring 47

    A Geometric Chart to Monitor Parameter ¿ 48

    The OC Curve 52

    2.5 Other Recent Developments 52

    References 54

    3 Variable Control Charts 57

    3.1 Introduction 57

    3.2 x¿ Control Charts 58

    3.3 Range Charts 72

    3.4 Construction of S-Chart 72

    3.5 Variance S2-Charts 75

    References 87

    4 Control Chart for Multiple Dependent State Sampling 91

    4.1 Introduction 91

    4.2 Attribute Charts Using MDS Sampling 91

    4.3 Conway-Maxwell-Poisson (COM-Poisson) Distribution 98

    4.4 Variable Charts 106

    4.5 Control Charts for Non-normal Distributions 107

    4.6 Control Charts for Exponential Distribution 109

    4.7 Control Charts for Gamma Distribution 111

    References 118

    5 EWMA Control Charts Using Repetitive Group Sampling Scheme 121

    5.1 Concept of Exponentially Weighted Moving Average (EWMA) Methodology 121

    5.2 Attraction of EWMA Methodology in Manufacturing Scenario 126

    5.3 Development of EWMA Control Chart for Monitoring Averages 127

    5.4 Development of EWMA Control Chart for Repetitive Sampling Scheme 127

    5.5 EWMA Control Chart for Repetitive Sampling Using Mean Deviation 128

    5.6 EWMA Control Chart for Sign Statistic Using the Repetitive Sampling Scheme 139

    5.7 Designing of a Hybrid EWMA (HEWMA) Control Chart Using Repetitive Sampling 147

    References 154

    6 Sampling Schemes for Developing Control Charts 161

    6.1 Single Sampling Scheme 161

    6.2 Double Sampling Scheme 162

    6.3 Repetitive Sampling Scheme 165

    6.4 Mixed Sampling Scheme 176

    6.5 Mixed Control Chart Using Process Capability Index 180

    References 187

    7 Memory-Type Control Charts for Attributes 191

    7.1 Exponentially Weighted Moving Average (EWMA) Control Charts for Attributes 191

    Performance Evaluation Measure 196

    Calculation of ARLs Using the Markov Chain Approach 196

    Geometric EWMA Chart 202

    Conway-Maxwell-Poisson (COM-Poisson) EWMA Chart 204

    7.2 CUSUM Control Charts for Attributes 209

    Performance Measure 219

    7.3 Moving Average (MA) Control Charts for Attributes 220

    References 226

    8 Multivariate Control Charts for Attributes 231

    8.1 Multivariate Shewhart-Type Charts 231

    Choice of Sample Size 233

    8.2 Multivariate Memory-Type Control Charts 243

    Design of MEWMA Chart 244

    8.3 Multivariate Cumulative Sum (CUSUM) Schemes 246

    References 248

    Appendix A: Areas of the Cumulative Standard Normal Distribution 251

    Appendix B: Factors for Constructing Variable Control Charts 253

    Index 255